

In the fast-paced world of marketing, it’s easy to get lost in a sea of data. Likes, shares, and website visits might feel like progress, but they often represent vanity metrics-numbers that look good on the surface but don't translate into tangible business success. True growth is driven by a deeper understanding of what actually works, which requires a strategic focus on the right marketing performance indicators. These are the quantifiable measures that connect your marketing efforts directly to your bottom-line objectives, such as revenue generation and customer retention.
Focusing on these core indicators helps you make smarter, data-driven decisions. Instead of guessing which campaigns are effective, you can pinpoint exactly what delivers value, optimise your spending, and demonstrate the real impact of your marketing strategies. To effectively move beyond superficial numbers, consider focusing on critical marketing metrics to track for growth that genuinely drive growth and provide actionable insights.
This guide moves beyond the fluff to provide a detailed roundup of the essential KPIs every business leader, from startup founders to established B2B marketers, should be monitoring. We will explore each indicator, defining what it is, how to calculate it, and why it's crucial for sustainable success, ensuring you're not just busy, but productive.
1. Return on Investment (ROI)
Return on Investment (ROI) is one of the most fundamental marketing performance indicators, revealing the direct financial profitability of your marketing efforts. It measures the net profit generated from a campaign against its total cost, typically expressed as a percentage. In essence, ROI answers the critical question: for every dirham spent, how much did we get back in profit?

The formula is straightforward: (Net Profit from Marketing – Marketing Cost) / Marketing Cost x 100. A positive ROI signifies a profitable campaign, while a negative one indicates a loss. This metric is essential for justifying marketing budgets and prioritising the most effective channels and strategies.
Why It's a Key Performance Indicator
ROI moves beyond vanity metrics like likes or shares to provide a clear, bottom-line assessment of campaign success. It directly ties marketing activities to revenue generation, a connection famously lamented by retail pioneer John Wanamaker with his quote, "Half the money I spend on advertising is wasted; the trouble is I don't know which half." Today, tracking ROI helps businesses pinpoint exactly which half is working.
Consider Dollar Shave Club's legendary launch video. With a modest production cost of around $4,500, the campaign went viral and helped generate an estimated $26 million in revenue, showcasing an astronomical ROI and proving the power of creative, cost-effective marketing.
How to Implement and Measure ROI
Accurately calculating ROI requires meticulous tracking and a comprehensive view of all associated expenses.
- Include All Costs: Your calculation must be exhaustive. Factor in media spend, creative production, agency fees, personnel salaries allocated to the project, and any technology or software subscriptions used.
- Set Attribution Windows: Define a clear timeframe for attributing sales to a campaign (e.g., 30, 60, or 90 days). This helps you accurately capture sales that don't happen immediately after a customer interacts with your marketing.
- Track Long-Term Impact: Some campaigns, like Coca-Cola's "Share a Coke," build brand equity over time. While it delivered an immediate 2.5% global sales lift, its long-term brand impact contributed to sustained revenue, which should be considered in a holistic ROI analysis.
2. Customer Acquisition Cost (CAC)
Customer Acquisition Cost (CAC) is a critical marketing performance indicator that calculates the total expense required to gain a new customer. It encompasses all marketing and sales costs over a specific period, divided by the number of new customers acquired in that same timeframe. CAC provides a clear, per-customer cost, answering the pivotal question: how much are we spending to bring each new buyer on board?

The formula is: (Total Marketing Costs + Total Sales Costs) / Number of New Customers Acquired. A lower CAC generally indicates a more efficient and sustainable customer acquisition strategy. This metric, popularised by SaaS pioneers like David Skok and Sean Ellis, is essential for budgeting, understanding profitability, and scaling a business responsibly.
Why It's a Key Performance Indicator
CAC shifts the focus from campaign-level spending to the sustainability of the entire business model. It provides a direct measure of the efficiency of your sales and marketing engine. If your CAC is higher than the revenue a customer will generate over their lifetime (Customer Lifetime Value or CLV), your business is fundamentally unprofitable.
Consider Dropbox’s early growth. Initially facing a CAC of over $300 through paid advertising, they pivoted to a referral programme that offered free storage. This viral loop dramatically lowered their CAC to just a few dollars, creating a sustainable model that fuelled their exponential growth and highlighted the power of optimising for acquisition cost.
How to Implement and Measure CAC
Calculating CAC accurately requires diligent tracking of all costs associated with attracting and converting leads into customers.
- Be Comprehensive with Costs: Your calculation must include all acquisition-related expenses. This means media spend, creative costs, tool subscriptions, and, crucially, the salaries and commissions of your sales and marketing teams.
- Calculate Blended and Channel-Specific CAC: Analyse a "blended" CAC (all costs divided by all new customers) for an overall health check. Also, calculate a channel-specific CAC (e.g., for Google Ads or social media) to identify your most efficient acquisition sources.
- Maintain a Healthy CAC to CLV Ratio: The golden rule for a healthy SaaS or subscription business is to maintain a CAC to CLV ratio of at least 1:3. This means for every dirham you spend to acquire a customer, you should expect to get at least three dirhams back in lifetime revenue.
3. Customer Lifetime Value (CLV/LTV)
Customer Lifetime Value (CLV or LTV) shifts the focus from single transactions to the total net profit a business can expect from a customer throughout their entire relationship. This forward-looking metric is one of the most vital marketing performance indicators for sustainable growth, as it helps justify customer acquisition spending and shapes long-term strategy. It answers the question: what is the total worth of one customer over time?
Calculating CLV can range from simple to complex, but a basic formula is: (Average Purchase Value x Average Purchase Frequency) x Average Customer Lifespan. This result provides a powerful forecast of future revenue and profitability, guiding decisions on how much to invest in acquiring new customers and retaining existing ones.
Why It's a Key Performance Indicator
CLV provides a crucial counter-balance to a singular focus on Customer Acquisition Cost (CAC). A high CAC might seem alarming on its own, but if the CLV is significantly higher, the investment is sound. This metric forces a business to prioritise customer satisfaction and retention, which are often more cost-effective than constant acquisition. The modern subscription economy, pioneered by companies like Salesforce, is built on maximising this very metric.
Amazon, for instance, understands this principle deeply. Its Prime members have a CLV reportedly double that of non-Prime customers, justifying the significant investment in Prime benefits like free shipping and streaming services. Similarly, when Adobe transitioned from selling software licences to a subscription model, its average CLV reportedly soared, demonstrating the power of a recurring revenue model.
How to Implement and Measure CLV
Measuring CLV accurately requires robust data and a commitment to understanding customer behaviour over time.
- Segment Your Customers: Not all customers are equal. Calculate CLV for different segments (e.g., by acquisition channel, demographic, or first purchase) to identify your most valuable cohorts and tailor marketing efforts accordingly.
- Focus on Key Levers: To boost CLV, concentrate on increasing average order value, purchase frequency, and customer lifespan. To delve deeper into boosting the long-term value of your customer base, explore additional strategies for improving customer lifetime value.
- Use Cohort Analysis: Group customers by the period they were acquired (e.g., Q1 2023) and track their spending behaviour over time. This provides a more accurate picture of CLV trends than a simple site-wide average. Learn more about how this feeds into powerful customer retention strategies.
4. Conversion Rate
Conversion Rate is a crucial marketing performance indicator that measures the percentage of users who complete a desired action. This action, known as a conversion, could be anything from making a purchase to signing up for a newsletter or downloading a white paper. It directly assesses the effectiveness of your marketing funnel and user experience in persuading visitors to take the next step.
The formula is simple: (Number of Conversions / Total Number of Visitors) x 100. For example, if your landing page receives 1,000 visitors and 50 of them sign up for a webinar, your conversion rate is 5%. This metric is fundamental for optimising web pages, ads, and entire campaigns to maximise their impact.
Why It's a Key Performance Indicator
Conversion Rate provides a clear verdict on the persuasive power of your marketing. While metrics like traffic show how many people you are reaching, conversion rate reveals how many you are successfully convincing. It bridges the gap between attracting an audience and generating tangible business results, making it a cornerstone of performance-driven marketing.
Consider how Barack Obama's 2012 presidential campaign leveraged this metric. Through rigorous A/B testing of their website's donation page, they tested different combinations of media and call-to-action buttons. One variation increased the signup conversion rate to 11.6%, a significant lift that translated into millions of additional campaign donations.
How to Implement and Measure Conversion Rate
Effective measurement requires precise tracking and strategic analysis to uncover actionable insights.
- Track Both Macro and Micro-Conversions: Distinguish between your primary goal (macro-conversion, e.g., a sale) and smaller steps along the way (micro-conversions, e.g., adding to cart or watching a video). Tracking both provides a more complete picture of user engagement.
- Segment Your Data: Do not rely on a single, site-wide conversion rate. Segment your data by traffic source, device, user demographics, and campaign. This helps you understand which channels and audiences are performing best and where optimisation is needed.
- Focus on the User Experience: To accurately measure and improve your conversion rate, understanding proper tracking setups is essential. For paid campaigns, tools like Google Ads conversion tracking are indispensable for attributing actions back to specific ads and keywords, allowing you to refine your strategy based on what truly drives results. Learn more about optimising your conversion rate.
5. Cost Per Acquisition (CPA)
Cost Per Acquisition (CPA), sometimes called Cost Per Action, is a financial metric that measures the aggregate cost to acquire one paying customer for a specific campaign or channel. It isolates the expense associated with a single desired action, such as a sale, a form submission, or a newsletter sign-up. This metric offers a granular view of campaign efficiency, answering the question: how much are we paying for each successful conversion?
The formula is direct: Total Cost of a Campaign / Number of Conversions. CPA is a cornerstone of performance marketing, heavily popularised by platforms like Google Ads and Facebook Ads, which allow advertisers to bid directly on conversion actions rather than just clicks or impressions. It provides a clear link between ad spend and tangible business outcomes.
Why It's a Key Performance Indicator
CPA is one of the most vital marketing performance indicators because it focuses on results, not just activity. Unlike metrics that track top-of-funnel engagement, CPA zeroes in on the final conversion, giving marketers a precise measure of their advertising spend's effectiveness in driving valuable actions. It forces a disciplined approach to budget allocation, steering investment towards campaigns that deliver conversions at an acceptable cost.
For example, a business knows its average customer lifetime value (LTV) is AED 1,000. It can then set a target CPA of, say, AED 200, ensuring each acquisition is profitable from the outset. This discipline is crucial; while a campaign might generate many cheap clicks, a high CPA reveals it isn't converting those clicks into actual customers, signalling a need for optimisation.
How to Implement and Measure CPA
Effective CPA management requires a strategic approach that balances cost with conversion quality.
- Set Targets Based on LTV: Your ideal CPA should be significantly lower than your Customer Lifetime Value (LTV). This ensures that each acquisition contributes positively to your long-term profitability.
- Use Automated Bidding: Platforms like Google Ads offer "Target CPA" bidding strategies. These use machine learning to automatically adjust bids in real-time to achieve your desired average CPA, optimising for conversions without manual intervention.
- Monitor Conversion Quality: A low CPA isn't always a victory. Track the quality of the acquisitions. Are customers acquired via a low-CPA campaign returning or making larger purchases? Ensure you are not sacrificing customer value for a lower acquisition cost.
- Consider View-Through Conversions: Don't just attribute conversions to the last click. A customer may see a display ad, not click, but convert later. Including view-through conversions in your attribution model provides a more holistic view of a campaign's impact on CPA.
6. Marketing Qualified Leads (MQL)
A Marketing Qualified Lead (MQL) is an individual who has shown interest in your brand's offerings based on marketing efforts and is deemed more likely to become a customer compared to other leads. This metric is crucial for bridging the gap between broad marketing activities and the tangible sales pipeline, acting as a critical handover point between the marketing and sales teams.
The MQL definition is not universal; it's determined by a company's unique lead scoring criteria, which might include actions like downloading an ebook, requesting a demo, or repeatedly visiting a pricing page. This systematic approach ensures the sales team focuses its energy on prospects who are already warmed up, making the entire process more efficient.
Why It's a Key Performance Indicator
Tracking MQLs is one of the most effective marketing performance indicators for B2B companies because it shifts the focus from quantity to quality. It prevents the sales team from wasting valuable time on unqualified prospects and provides a clear signal of marketing's contribution to the sales funnel. It answers the question: how many genuinely interested prospects are we generating for the sales team to pursue?
Marketing automation pioneers like Marketo and HubSpot popularised the MQL framework. For instance, HubSpot generates over 100,000 MQLs monthly through its extensive content marketing, while Salesforce has used behavioural scoring to identify MQLs that demonstrate a 40% higher conversion rate, proving the model's effectiveness in driving revenue.
How to Implement and Measure MQLs
Success with MQLs hinges on alignment between marketing and sales, supported by robust tracking.
- Define Criteria Jointly: Your marketing and sales teams must collaborate to create a clear, agreed-upon definition of an MQL. This Service Level Agreement (SLA) should outline the specific behaviours, demographics, and engagement levels that qualify a lead.
- Establish Lead Scoring: Implement a points-based system that assigns value to different lead attributes and actions. A lead accumulates points for activities like opening an email, downloading a whitepaper, or visiting key web pages, and becomes an MQL once they reach a predetermined score threshold.
- Track MQL to SQL Conversion: The ultimate test of your MQL quality is how many convert to Sales Qualified Leads (SQLs) and, eventually, customers. Regularly monitor this conversion rate to refine and improve your lead scoring model and qualification criteria.
7. Brand Awareness Metrics
Brand Awareness Metrics gauge how familiar and recognisable your brand is within your target audience. These crucial marketing performance indicators move beyond direct sales to measure your brand’s cultural footprint and market position. They include metrics like aided recall (prompted recognition), unaided recall (spontaneous recognition), and share of voice, revealing how top-of-mind your brand is compared to competitors.

Ultimately, brand awareness answers the question: do people think of you when they consider a purchase in your category? While not a direct sales figure, strong awareness is the foundation upon which consideration and preference are built. Pioneered by market research firms like Nielsen and brand equity expert David Aaker, these metrics are vital for long-term growth.
Why It's a Key Performance Indicator
Brand awareness is a leading indicator of future market share and pricing power. A brand that is easily recognised and recalled is more likely to be chosen over a lesser-known competitor, even if product features are similar. This metric is especially important for top-of-funnel marketing activities designed to build a long-term relationship with potential customers rather than drive immediate conversion.
Consider Tesla, which famously achieved an estimated 92% brand awareness without significant traditional advertising spend, relying instead on PR, social media, and the personal brand of its CEO. This demonstrates how powerful organic awareness can be in creating a dominant market presence and a loyal customer base. Similarly, Old Spice’s viral campaigns increased its unaided awareness by a staggering 60%, reviving the brand for a new generation.
How to Implement and Measure Brand Awareness
Measuring brand awareness requires a combination of direct feedback and digital analysis, allowing you to track perception over time.
- Use Consistent Survey Methodology: Regularly survey your target demographic to track aided and unaided recall. Ask questions like, "What brands come to mind when you think of [product category]?" and "Which of these brands have you heard of?" Consistency in questioning and sampling is key to reliable tracking.
- Combine with Digital Listening: Supplement surveys with social listening tools like Brandwatch or Mention. Track brand mentions, sentiment, and share of voice (your brand’s mentions vs. competitors') across social media, blogs, and news sites to get a real-time pulse on public conversation.
- Track Within Target Segments: Don’t just measure overall awareness. Analyse how awareness levels differ across your most valuable customer segments. A high overall score might mask low awareness within a crucial niche demographic you are trying to capture.
8. Marketing Attribution and Multi-Touch Attribution
Marketing attribution is the science of assigning credit to the various marketing touchpoints a customer interacts with on their path to conversion. It moves beyond a simplistic last-click view to understand the entire customer journey. Sophisticated multi-touch attribution models distribute value across multiple interactions, providing a holistic understanding of which channels truly influence purchasing decisions. This helps answer the crucial question: which marketing efforts are most effective at driving conversions?
These models are vital marketing performance indicators because they provide the insights needed to optimise media spend and strategy. By understanding which channels assist conversions versus those that close them, marketers can allocate budgets more intelligently to maximise overall campaign performance.
Why It's a Key Performance Indicator
In a complex digital ecosystem, customers rarely see one ad and convert immediately. They interact with your brand across social media, search engines, email, and content marketing. Attribution illuminates this entire journey, preventing marketers from overvaluing the final touchpoint and undervaluing the channels that initiated or nurtured the lead. It provides a data-backed foundation for strategic decisions.
For example, Google’s data-driven attribution model helped its advertisers achieve an average 6% increase in conversions at a similar cost-per-action by analysing all relevant path data. Similarly, by using Adobe's attribution solution, Lenovo was able to better understand its media mix and reallocate budget to higher-performing channels, improving overall efficiency.
The following infographic illustrates three fundamental attribution models, showing how credit is assigned differently in each.
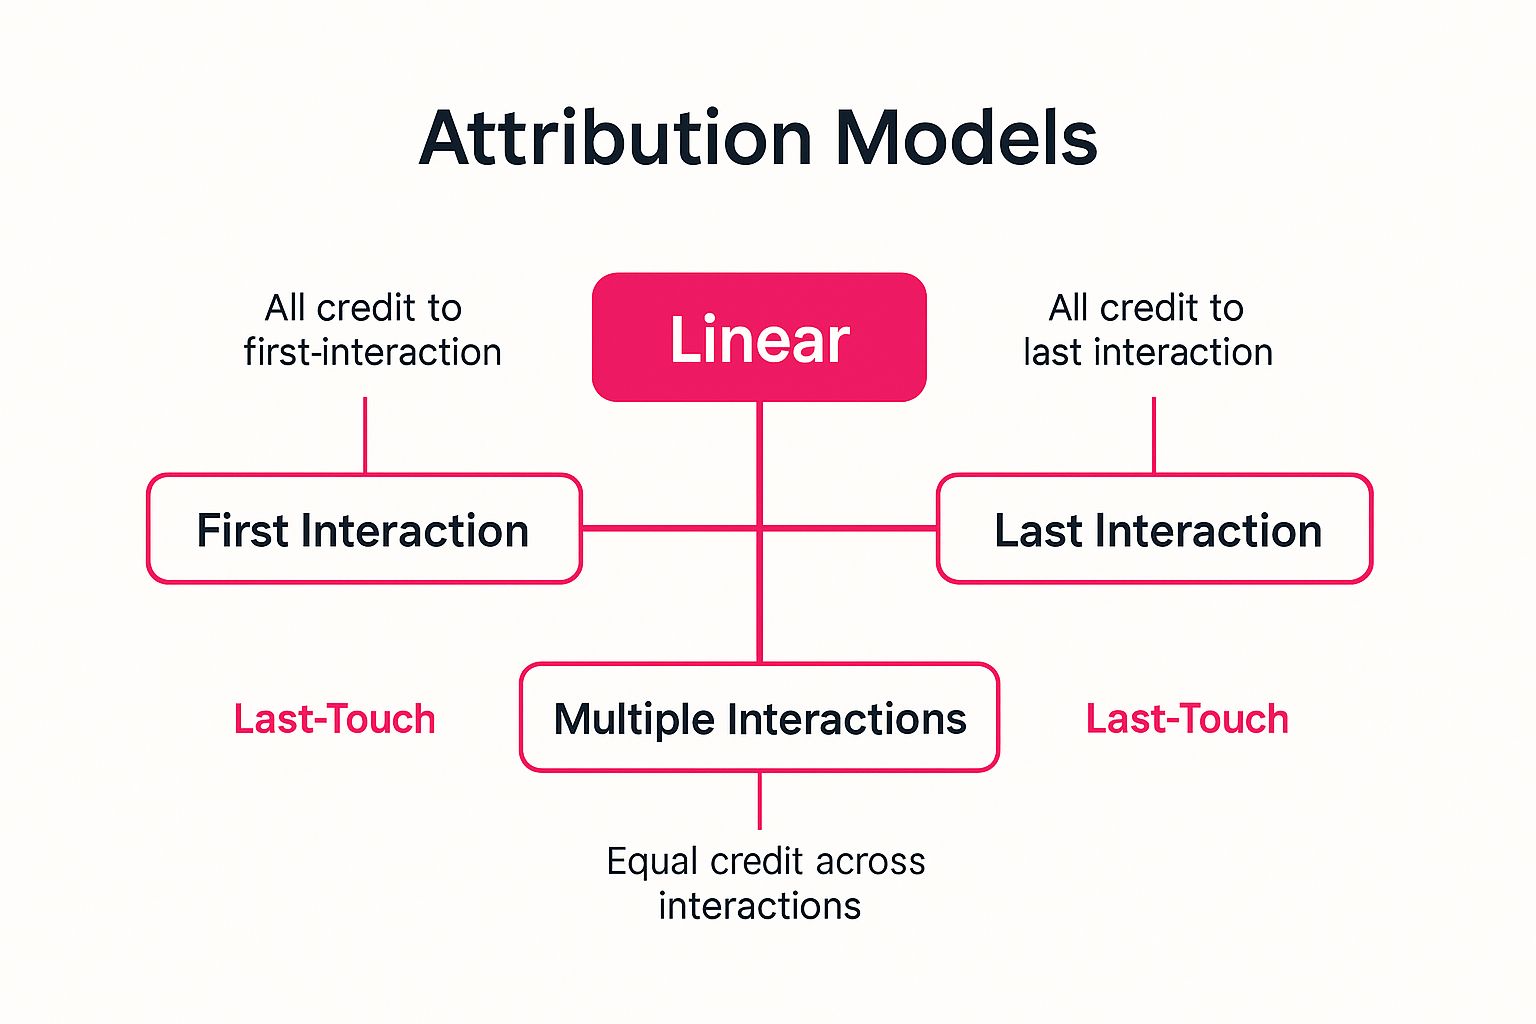
This visualisation highlights the core difference between single-touch models like 'First-Touch' and 'Last-Touch' versus the more balanced 'Linear' model, which distributes credit evenly.
How to Implement and Measure Attribution
Effective attribution requires a strategic approach and consistent data hygiene. It's not just about choosing a model; it's about building a framework for accurate measurement.
- Implement Consistent UTM Tracking: Use consistent UTM parameters across all campaigns, channels, and links. This is the foundational layer of data collection required for any attribution model to work accurately.
- Start Simple, Then Advance: Begin with basic models like last-touch or first-touch, which are readily available in platforms like Google Analytics. As your team’s analytical maturity grows, progress to more complex models like linear, time-decay, or data-driven attribution.
- Validate Models Against Outcomes: Regularly compare the insights from your attribution model against actual business outcomes and sales data. If the model suggests boosting a channel but it doesn't lead to a corresponding lift in revenue, the model may need recalibration. Robust marketing campaign tracking on grassrootscreativeagency.com is essential for this validation process.
Key Marketing Performance Indicators Comparison
| Metric | Implementation Complexity 🔄 | Resource Requirements ⚡ | Expected Outcomes 📊 | Ideal Use Cases 💡 | Key Advantages ⭐ |
|---|---|---|---|---|---|
| Return on Investment (ROI) | Low – Simple formula and calculation | Low – Requires financial data | Clear financial justification and campaign efficiency | Budget optimization and financial evaluation | Easy to calculate, ties marketing to profits |
| Customer Acquisition Cost (CAC) | Medium – Requires detailed cost tracking | Medium – Sales & marketing data integration | Clear cost structure for growth and channel efficiency | SaaS, subscription models, investor reporting | Identifies efficient acquisition channels |
| Customer Lifetime Value (CLV) | High – Complex predictive calculations | High – Needs historical customer data | Long-term profitability insights and retention guidance | Subscription models, long customer relationships | Justifies acquisition costs, aids segmentation |
| Conversion Rate | Low – Simple tracking and formula | Low – Web analytics tools | Measures funnel effectiveness and identifies bottlenecks | E-commerce, lead generation, funnel optimization | Direct indicator of marketing effectiveness |
| Cost Per Acquisition (CPA) | Medium – Specific campaign cost tracking | Medium – Advertising and platform data | Direct link between spend and specific acquisition actions | Digital advertising and performance marketing | Clear ROI on specific conversion actions |
| Marketing Qualified Leads (MQL) | Medium – Requires scoring systems | Medium – CRM and automation platforms | Pipeline predictability and improved marketing-sales alignment | B2B marketing and lead nurturing | Focus on lead quality, improves resource allocation |
| Brand Awareness Metrics | Medium – Surveys and data collection | High – Surveys, social listening, research | Measures brand equity and long-term brand health | Brand marketing, competitive intelligence | Correlates with long-term performance |
| Marketing Attribution | High – Complex multi-touch models | High – Advanced analytics and integration | Holistic understanding of customer journey and channel impact | Omnichannel marketing strategy and budget allocation | Reveals hidden channel contributions |
Turning Data into Dominance: Your Path Forward
Navigating the complex landscape of digital marketing without clear signposts is a recipe for wasted resources and missed opportunities. The marketing performance indicators we have explored are more than just numbers on a dashboard; they are the critical instruments that guide your strategic decisions, illuminate your path to growth, and transform your marketing efforts from guesswork into a predictable engine for success. Moving beyond simple vanity metrics to embrace these deeper, more meaningful indicators is the defining characteristic of a data-driven, results-oriented organisation.
We have journeyed through the foundational metrics of Return on Investment (ROI) and Customer Acquisition Cost (CAC), which together form the financial backbone of your marketing health. We then delved into the long-term strategic value of understanding Customer Lifetime Value (CLV), recognising that sustainable growth is built on relationships, not just transactions. By mastering Conversion Rate and Cost Per Acquisition (CPA), you gain granular control over your campaign efficiency, ensuring every dirham spent is optimised for maximum impact. Finally, by generating Marketing Qualified Leads (MQLs), measuring Brand Awareness, and implementing sophisticated Marketing Attribution models, you create a holistic, 360-degree view of your entire marketing funnel, from the first touchpoint to the final sale.
Your Actionable Roadmap to Mastering Marketing Performance
The true power of these marketing performance indicators is unlocked not by simply knowing what they are, but by actively integrating them into your daily operations and strategic planning. Here are your immediate next steps:
- Establish Your Baseline: You cannot improve what you do not measure. Your first task is to calculate your current standing for each relevant KPI. Use the formulas and tools discussed to establish a clear baseline. This is your "Point A."
- Set SMART Goals: With your baseline established, set Specific, Measurable, Achievable, Relevant, and Time-bound goals. For example, aim to "reduce CAC by 15% in Q3" or "increase our CLV-to-CAC ratio to 4:1 within the next 12 months."
- Integrate and Automate: Manually tracking these metrics is inefficient and prone to error. Invest in a marketing analytics dashboard or CRM that integrates with your various platforms. Automate your reporting so you can spend less time collecting data and more time analysing it.
- Foster a Culture of Accountability: Share these key performance indicators with your team. When everyone from the content creator to the social media manager understands how their work directly impacts metrics like CPA and MQLs, you create a powerful culture of ownership and shared success.
Mastering these concepts is not just about producing better reports; it is about building a more resilient, profitable, and competitive business. It is about making smarter investments, understanding your customers on a profound level, and confidently steering your brand towards market leadership. The data holds the story of your business's potential; learning to read it is your key to unlocking dominance.
Feeling overwhelmed by the data? Let us help you turn those complex marketing performance indicators into a clear strategy for growth. At Grassroots Creative Agency, we specialise in analytics-driven marketing that delivers measurable results for brands in the UAE and beyond. Schedule a consultation with our team and let's build your path to dominance together.