
Building Your Tracking Foundation Without The Overwhelm
Before you even think about opening an analytics tool, let’s get one thing straight. Great marketing campaign tracking isn't about hoarding every scrap of data you can find. It's about asking the right questions from the very beginning. So many marketers drown in numbers because they skipped the most important part: defining what success actually means for their business goals. It's a classic case of putting the cart before the horse.
Imagine you're building a house. You wouldn't just order a pile of bricks and a few windows without a detailed blueprint, would you? Your Key Performance Indicators (KPIs) are that blueprint for your marketing. They have to connect directly to your main business objectives. If your goal is to boost online sales, tracking website traffic is nice, but tracking your conversion rate and average order value is absolutely essential.
Moving Beyond Vanity Metrics
It's easy to get a thrill from big numbers like thousands of impressions or a flood of social media likes. We call these vanity metrics. They look impressive on a report but often don't mean much for your bottom line. A post could get a thousand likes and lead to exactly zero sales. The real magic happens when you focus on actionable metrics that tell you a story about what your customers are actually doing.
For instance, instead of just counting new followers from an Instagram campaign, why not measure:
- Website Clicks: How many people were intrigued enough to leave the app and visit your site?
- Email Sign-ups: Who was ready to build a more meaningful relationship with your brand?
- Sales via Promo Code: Which specific campaign actually brought in revenue?
This simple shift in thinking—from "How many people saw our ad?" to "What did people do after seeing our ad?"—is the core of effective marketing campaign tracking.
Aligning Goals With Business Realities
Setting realistic goals is another common hurdle. A small e-commerce startup in Dubai hoping for 10,000 sales in its first month is probably setting itself up for a letdown. A much better way is to set benchmarks. Check your own past performance, or if you're just starting out, look up industry averages. Start with a manageable goal, measure your results, learn from them, and then aim higher as you gather more data.
To get your data collection and analysis in order, it's helpful to explore a range of marketing software tools that can help build a solid tracking setup. This methodical approach turns tracking from a scary chore into a smart, strategic process.
The focus on measurement is growing fast, especially in markets like the United Arab Emirates and the wider region that are rapidly embracing digital. In fact, the digital marketing analytics market in the Middle East and Africa was valued at about USD 90.36 million in 2024. It’s expected to grow at a compound annual growth rate of 20.6% through 2031. This shows just how much of an edge businesses gain when they truly understand their data. You can dig deeper into these trends by checking out the full market research on cognitivemarketresearch.com. Building this strong foundation ensures every dirham you spend on marketing is working hard and delivering real results.
Setting Up Tracking That Actually Works
Once you've laid a solid groundwork with your KPIs, it's time to roll up your sleeves and get into the technical side of marketing campaign tracking. This is often where great strategies can stumble if the execution isn't clean. The aim isn't just to slap some code on your site; it's to build a dependable system that tells you exactly which marketing efforts are bringing in the results. Think of it as plumbing for your data—get it right from the start, and everything flows smoothly.
This infographic lays out a common workflow, from defining your KPIs all the way to seeing the results on a dashboard.
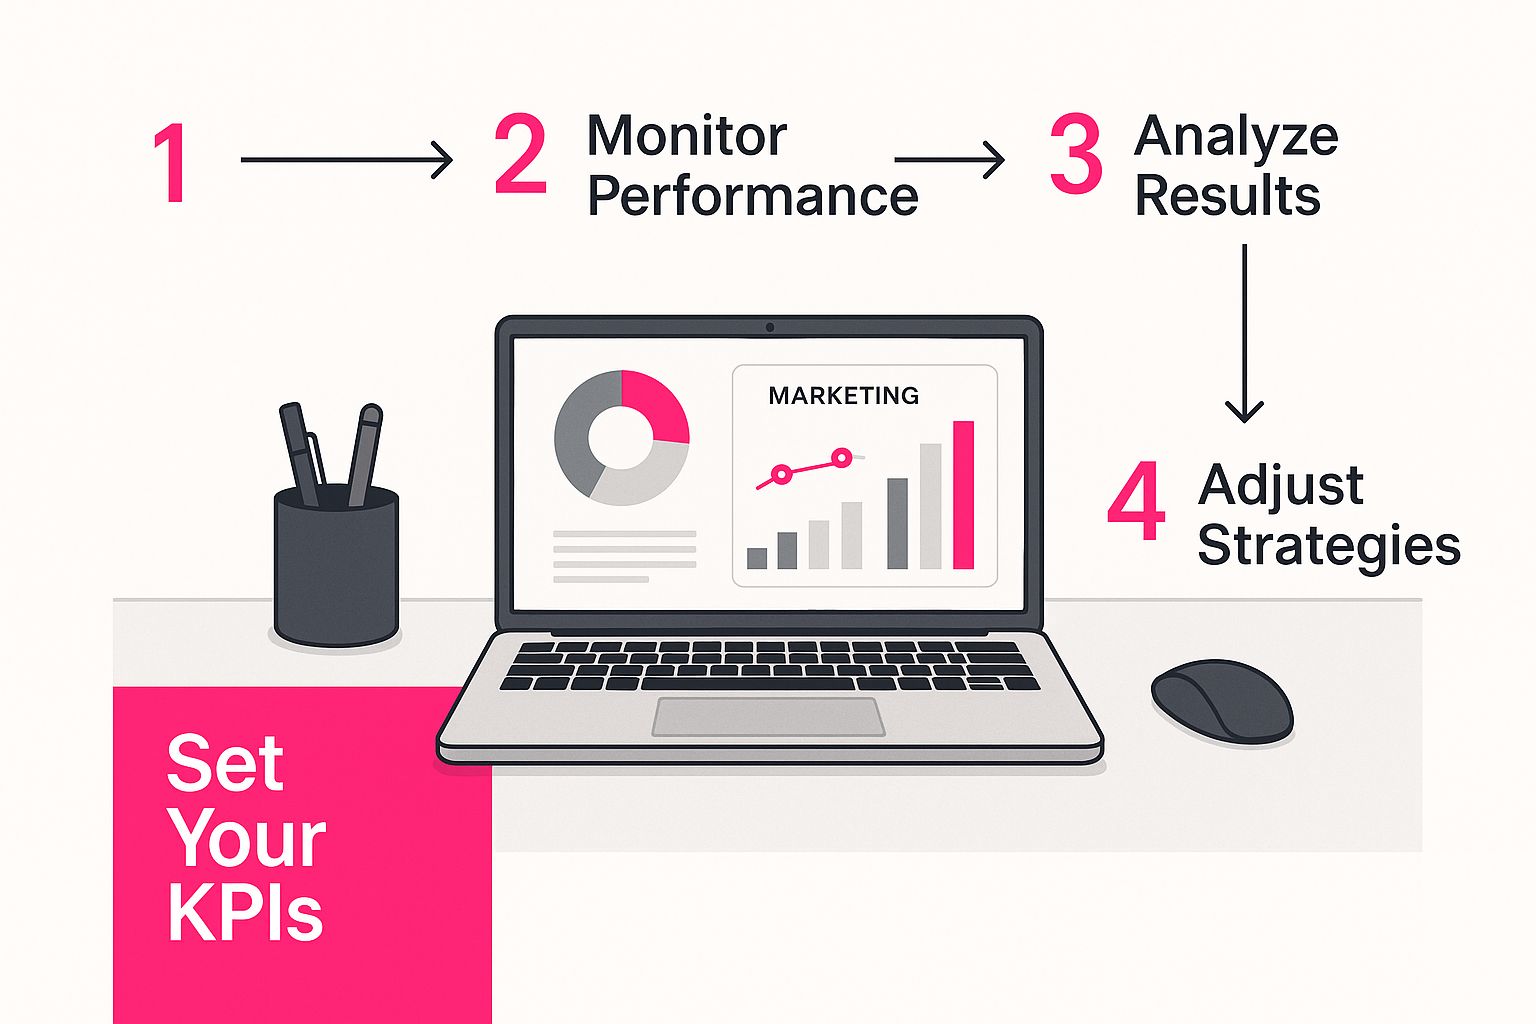
As you can see, starting with clear KPIs is the first and most important piece, ensuring the entire tracking process is laser-focused on your specific business goals.
Mastering UTMs and Pixels
The real workhorses of campaign tracking are Urchin Tracking Modules (UTMs) and tracking pixels. UTMs are small bits of text added to the end of your URLs. They act like little signposts, telling your analytics tools precisely where a visitor came from. A key technical skill here is understanding how to properly manage passing URL parameters, as this is the engine that makes UTMs work.
Meanwhile, tracking pixels, like the Meta Pixel (formerly Facebook Pixel) or the Google Ads tag, are bits of code you install on your website. These pixels monitor user actions, such as viewing a product, adding an item to the basket, or completing a checkout. Getting these implemented correctly is absolutely essential for measuring your return on ad spend (ROAS) and understanding customer behaviour.
To keep your data from becoming a chaotic mess, you need a strict naming convention for your UTMs right from day one. A simple, consistent structure can save you massive headaches later on. Here’s a basic framework I always recommend:
- utm_source: The platform that sent you the traffic (e.g.,
facebook,google,newsletter). - utm_medium: The type of marketing channel (e.g.,
cpc,social,email). - utm_campaign: The specific promotion or campaign name (e.g.,
ramadan_sale_2024).
This level of organisation is a core component of any effective digital marketing plan. You can learn more about creating a digital marketing strategy in our article to see how this kind of detailed tracking fits into the bigger picture.
To help you get started, here's a quick comparison of the essential UTM parameters.
Essential Tracking Parameters Comparison
A comprehensive comparison of UTM parameters, their purposes, and best practices for implementation across different campaign types.
| Parameter | Purpose | Required/Optional | Best Practice Example |
|---|---|---|---|
| utm_source | Identifies the traffic source, like a search engine or social network. | Required | google, facebook, linkedin, newsletter |
| utm_medium | Identifies the marketing medium, like email or cost-per-click (CPC). | Required | cpc, social_paid, email, organic |
| utm_campaign | Identifies the specific campaign or promotion. | Required | ramadan_sale_2024, summer_promo, new_product_launch |
| utm_term | Used for paid search to identify the keywords for your ad. | Optional | dubai_real_estate, luxury_car_rental |
| utm_content | Differentiates similar content or links within the same ad. | Optional | blue_button_ad, video_ad_version2, header_link |
Using this table as a guide will help ensure your campaign data is clean, organised, and easy to analyse from the get-go.
Connecting Your Tools for a Unified View
Your tracking tools shouldn't be working in silos. The real magic happens when you connect them. For example, make sure your Google Analytics is correctly linked to your Google Ads account. This simple connection allows you to see not just which ads drove clicks, but which of those clicks actually led to valuable actions on your site, like a form submission or a sale.
This sort of integration is becoming more important in the Middle East's growing MarTech scene. The regional market, valued at around USD 8.29 billion in 2024, is expanding quickly because businesses are seeing the immense value of connected data systems for optimising their campaigns. You can explore this growth in the Middle East marketing technology market report. A well-integrated setup gives you a complete picture of your marketing performance, turning what was once scattered data into clear, actionable insights.
Creating Dashboards People Actually Use
All that carefully collected tracking data is useless if it’s gathering digital dust in a spreadsheet nobody understands. Effective marketing campaign tracking hinges on turning those raw numbers into something visual, intuitive, and, most importantly, something you can act on. The goal isn't to create a data dump; it's to build a narrative that tells your team exactly what's happening at a glance.
A well-designed dashboard should immediately answer key questions, not create more of them. This means moving beyond default templates and building reports tailored to the people who will be using them.
Tailoring Dashboards for Different Roles
The first rule of dashboard creation is to know your audience. An executive doesn't need to see the click-through rate of every ad variation, but your campaign manager absolutely does. Trying a one-size-fits-all approach is a recipe for a dashboard that serves no one well.
-
For the Executive (The "Big Picture" View): This dashboard needs to be clean and high-level. Focus on the core business outcomes your marketing efforts are driving. The most important metrics here are usually Customer Acquisition Cost (CAC), Return on Ad Spend (ROAS), total leads generated, and influenced revenue. A simple line graph showing revenue trends against marketing spend can be incredibly powerful.
-
For the Campaign Manager (The "In-the-Trenches" View): This is where you get into the details. This user needs to see performance by channel, campaign, and even individual ads. Key metrics include Cost Per Click (CPC), Conversion Rate, and Click-Through Rate (CTR). Using tables and bar charts to compare different UTM campaigns or ad sets helps them quickly spot what's working and where to shift the budget for better results.
Designing for Clarity and Action
A great dashboard isn't just about what you include; it's about what you leave out. Too much information leads to analysis paralysis. Use visual hierarchy to your advantage—place the most critical KPIs at the top in large, clear widgets. Use colour-coding thoughtfully; for example, green for positive trends and red for areas needing attention. This simple visual cue draws the eye immediately to what matters most.
Think about setting up automated alerts for significant changes. An alert that flags a sudden 50% drop in landing page conversion rate is far more useful than having to manually check it every day. This proactive approach turns your dashboard from a passive reporting tool into an active monitoring system, forming the backbone of a responsive marketing campaign tracking strategy. By building with the end-user in mind, you create a resource that becomes an indispensable part of your team's daily routine, driving smarter and faster decisions.
Making Sense Of Your Data Without A Statistics Degree

You've set up your tracking, your dashboards are live, and the data is flowing in. So, what’s next? This is often where marketers feel a bit overwhelmed, looking at a screen full of numbers and wondering what story it’s all trying to tell. But here's the good news: you don't need a fancy maths degree to pull out valuable insights. Good marketing campaign tracking is really more about being curious and using common sense than it is about complex equations.
It all begins with learning to spot patterns and, just as importantly, anything that looks out of place. Put on your detective hat. If your website's bounce rate suddenly shoots up the very same day you launch a new ad campaign, that’s a huge clue. It might suggest your ad is promising something your landing page isn't delivering. This isn't a failure; it's a golden piece of feedback telling you exactly where to focus your attention.
From Correlation to Actionable Insight
One of the easiest traps to fall into when looking at data is mixing up correlation with causation. Just because your ice cream sales and social media likes both increased in July doesn’t mean one caused the other; the summer heat probably had a hand in both. To uncover what’s really causing what, you need to search for direct connections. Did the people who liked your social posts actually click the link and buy something? This is where your UTM tracking becomes your most trusted tool.
By isolating different elements, you can test your hunches. For instance, if you think a certain ad creative is the reason for a spike in conversions, run an A/B test. Pit it against a different creative, but keep the audience and budget identical. The version that gets a higher conversion rate isn't just correlated with success—it's a direct cause. This systematic method turns your gut feelings into decisions backed by solid data. To make sure your data is reliable, it's worth getting familiar with essential data cleaning techniques to filter out any noise that might be skewing your results.
Reading the Customer Journey
Your data does more than just measure individual campaigns; it paints a picture of the entire customer journey. Take a look at the attribution models in your Google Analytics account. Do you notice a pattern where many customers first find you through an organic search, see a social media ad a few days later, and then finally convert after an email? This shows that every one of those touchpoints played a part. If you were to cut the budget for your 'awareness' stage organic efforts, you might accidentally harm your 'conversion' stage email performance.
This need for deep analysis is driving huge investments in the MENA region. The advertising market was projected to be around USD 12.3 billion for 2024, with spending on internet ads set to grow by about 20%. As more money moves into digital channels where results can be measured, the skill of correctly interpreting data becomes a serious competitive advantage. You can discover more about advertising trends in the region from Statista. Building this analytical confidence allows you to trust your own insights and act on them, turning marketing campaign tracking from a simple reporting chore into one of your most powerful strategic assets.
Turning Insights Into Better Campaign Performance

This is where your careful marketing campaign tracking starts to pay off. You’ve collected the data and figured out the story it's telling; now it's time to make those insights work for you. Optimisation isn’t about huge, complicated overhauls. More often than not, the biggest improvements come from small, strategic adjustments based on what your analytics reveal.
Picture yourself as a campaign 'tuner'. If your data shows a particular ad set on Instagram is getting you a brilliant Cost Per Acquisition (CPA) but another on Facebook is falling behind, your first move is clear. Shifting your budget from the underperformer to the star player is a straightforward way to boost your overall return. This kind of nimble budget management is a fundamental skill in data-driven marketing.
Prioritising Your Optimisation Efforts
With a finite amount of time and money, you can't tackle everything at once. This is why having a clear framework for deciding what to focus on first is essential. We often use a simple matrix to sort potential actions by how much impact they'll have versus the effort they require.
To help you organise your thoughts, we've put together a "Campaign Optimisation Action Matrix." This is a strategic framework that outlines different optimisation tactics based on common performance issues and the effort needed to implement them.
Campaign Optimisation Action Matrix
A strategic framework showing different optimisation tactics based on campaign performance metrics and effort required to implement
| Performance Issue | Quick Wins (Low Effort, High Impact) | Medium-term Solutions (Medium Effort) | Long-term Strategies (High Effort) |
|---|---|---|---|
| Low Click-Through Rate (CTR) | Tweak the ad headline or call-to-action (CTA) | A/B test different ad creatives or images | Conduct new audience research to refine targeting |
| High Bounce Rate on Landing Page | Check for mobile optimisation issues or slow speed | Rewrite landing page copy for better ad message alignment | Redesign the entire landing page layout and user flow |
| Low Conversion Rate | Adjust bids on your highest-performing keywords | Refine targeting to a more specific, niche audience segment | Develop a completely new lead magnet or special offer |
| High Cost Per Acquisition (CPA) | Pause ad groups or campaigns that are underperforming | Test different bidding strategies (e.g., target CPA, max conversions) | Overhaul the entire campaign funnel from top to bottom |
This table helps you see that you should always start with the Quick Wins. These are small adjustments, like tweaking an ad's headline or pausing an underperforming ad group, that can deliver results almost immediately without needing a massive time investment. For instance, systematically testing email subject lines is a classic tactic that can significantly improve open rates. For some real-world ideas, check out these powerful email marketing examples that demonstrate how small changes can make a huge impact.
The key takeaway is to focus on low-effort, high-impact tasks first to build momentum and improve performance without draining your resources.
The Art of Systematic Testing
Beyond the quick fixes, genuine optimisation is all about systematic testing. When you decide to try a new ad creative, for example, only change that one element. If you change the image, the headline, and the audience targeting all at the same time, you'll never know which change was actually responsible for the results.
The golden rule is to isolate one variable at a time, measure the outcome, and then act on what you've learned. This methodical approach is the secret to continuous improvement. It transforms your marketing campaign tracking from a simple reporting task into a proactive engine that drives real growth for your business.
Advanced Tracking For Serious Marketers
When you feel you’ve mastered the basics, it’s time to explore the deeper insights that marketing campaign tracking can offer. This is where you connect the dots that aren’t immediately obvious, painting a much clearer picture of how customers engage with your brand across different platforms and devices. It’s less about just seeing what happened and more about understanding the intricate journey that led to a conversion.
Understanding the Complete Customer Journey
Think about it: a customer rarely sees a single ad and instantly decides to buy. Their path is usually more complex. They might first spot your brand on Instagram, do some research on their work laptop, and then finally click a link in your newsletter from their phone a week later. Standard tracking, known as last-click attribution, would give all the credit to that final newsletter click. This approach completely misses the vital roles Instagram and your website played earlier on.
This is where multi-touch attribution becomes incredibly useful. Using models like linear, time-decay, or position-based attribution, which are available in tools like Google Analytics, you can distribute credit more fairly across each touchpoint. This provides a far more accurate view of which channels are great for creating initial awareness versus those that excel at sealing the deal. This comprehensive perspective is essential for making smarter budget allocations. For instance, you might discover your social media efforts are generating significant initial interest, justifying their budget even if they aren't directly driving the final sale.
Connecting Data Across Devices and Channels
The next piece of the puzzle is cross-device tracking. This involves identifying a single user as they switch between their phone, work computer, and home tablet. It's a challenging area, especially with evolving privacy regulations, but the insights are powerful. Major platforms like Google and Meta accomplish this by tracking user logins, which creates a unified view of behaviour across their ecosystem.
This concept also extends to bridging the gap between your online marketing and offline results. By integrating data from your CRM or point-of-sale system with your web analytics, you can see how a digital campaign might be driving in-store purchases. A fantastic way to put these connections into practice is by designing automated sequences that trigger based on user behaviour across various platforms. For some great inspiration, you might want to look into these marketing automation workflow examples.
Looking Ahead with Predictive Analytics
The true frontier of advanced tracking is using what you’ve learned to forecast what will happen next. Predictive analytics applies machine learning to your historical data to anticipate future trends. For example, it can pinpoint which leads are most likely to convert, allowing your sales team to focus their efforts where it counts most. It can also help you anticipate how a campaign will perform, giving you the chance to tweak your strategy before you’ve spent your entire budget. While this may sound complex, many modern marketing platforms are beginning to integrate these predictive features, making these powerful techniques more accessible than ever.
Your Marketing Campaign Tracking Action Plan
So, how do we pull all these ideas together into something you can actually use? Great marketing campaign tracking isn't about one magic tool; it's about building a solid system. Let's walk through a practical roadmap to turn these concepts into your daily routine.
The Pre-Launch Checklist: Your First 30 Days
Before you spend a single dirham, you need to lay the groundwork. This initial phase is all about getting your technical setup right and achieving total clarity on your goals. Don't rush this part. A bit of patience now will save you from a world of messy data and headaches later.
- Define What Winning Looks Like: Settle on your top 3-5 KPIs. These should be metrics that speak directly to your business goals, like Cost Per Acquisition, Conversion Rate, or even Influenced Revenue.
- Get Your Tech in Order: This is where you install and, crucially, verify your tracking codes. Think of the Meta Pixel, the Google tag, and any others you need. Make sure they are firing correctly on essential pages, especially your "thank you" or confirmation pages.
- Master Your UTMs: Create a shared spreadsheet or use a tool to establish a strict UTM naming convention for your entire team. I can't stress this enough—consistency is the key to clean, usable data. As HubSpot points out, linking tracking URLs to a campaign from the very beginning helps organise everything and makes reporting much simpler.
- Build Your Dashboard Skeleton: Even before the data starts rolling in, build a basic dashboard in a tool like Google Analytics 4 or Looker Studio. Add widgets for your main KPIs. This way, you’re prepared to visualise performance the moment your campaign goes live.
Launch and Monitor: Days 31-90
Once your campaigns are out in the wild, your job shifts from setup to active observation. This is when the fun begins, and you start to see the early signs of what’s working and what isn’t.
- Set a Weekly Data Ritual: Block out time in your calendar each week to dive into your campaign dashboards. Look for anything that stands out, both good and bad. Is one ad creative crushing the others? Is a specific landing page seeing an unusually high bounce rate?
- Spot the Early Red Flags: A classic warning sign is a high click-through rate paired with a disappointingly low conversion rate. This almost always points to a disconnect between what your ad promises and what the landing page delivers.
- Make Your First Smart Tweaks: Now you can make your first data-informed adjustments. Start with the quick wins. For example, shift a small part of your budget from an ad set that's lagging to one that's clearly a top performer.
By taking this structured approach, you change marketing campaign tracking from a reactive chore into a proactive strategy that fuels real growth.
Ready to put a data-driven action plan to work for your brand? The team at Grassroots Creative Agency specialises in building and executing marketing strategies backed by precise analytics. Contact us today to see how we can drive measurable results for your business.