

Think of marketing data analysis as the process of turning a giant pile of raw information into gold. It's about taking all that customer data, campaign metrics, and sales figures and translating it into smart, effective marketing decisions. You stop relying on gut feelings and start using concrete evidence to truly understand your customers, see what's working, and prove your marketing is paying off. This shift from guesswork to data-backed strategy is what separates the brands that flourish from the ones that get left behind.
Why Data Analysis Is Your Marketing Superpower
Picture this: you're trying to sail a ship through a massive storm, but you have no map and no compass. You might get lucky and make some headway based on pure instinct, but you're really just hoping you don't crash. That's a lot like what marketing feels like without data analysis—a series of hopeful shots in the dark instead of a reliable engine for growth.
Data analysis is the strategic compass for your marketing ship. It shines a light on the murky waters of customer behavior, showing you not just who your customers are, but why they do what they do. This deeper understanding is the bedrock of any great marketing campaign, letting you connect with people in a way that actually resonates.
From Guesswork to Growth
When you don't have data, your marketing decisions are built on a shaky foundation of assumptions. You think a certain ad will resonate, or you believe your audience hangs out on a specific social media platform. With data analysis, you get to swap those assumptions for solid proof.
For instance, after digging into your website traffic and engagement stats, you might find that your audience in the UAE goes wild for video content posted in the evening. That single piece of information is more valuable than a week's worth of brainstorming. It gives you a clear, actionable path for your content plan and budget, making sure every dollar is spent where it will make the biggest splash.
A data-driven approach transforms marketing from a cost center into a profit driver. It's been shown that companies that get a handle on customer analytics report significantly higher profits and ROI than their competitors who are still winging it.
Uncovering Hidden Opportunities and Risks
Beyond just fine-tuning what you're already doing, data analysis is a discovery tool. It helps you find untapped pockets of the market, spot new trends as they're just starting to bubble up, and catch potential problems before they become full-blown crises.
Here’s what this looks like in practice:
- Identifying High-Value Customers: Data can show you exactly which customer groups are worth the most over their lifetime. This lets you focus your retention efforts and acquisition campaigns with surgical precision.
- Optimizing the Customer Journey: By tracking how people interact with your brand at every step, you can find and fix the frustrating parts of their experience, which naturally leads to more conversions.
- Proving Marketing ROI: Clear data lets you connect the dots between specific campaigns and actual sales. You can finally walk into a meeting and show stakeholders exactly how your marketing efforts are contributing to the bottom line.
Ultimately, embracing data analysis for marketing isn't really a choice anymore—it's a must for survival and growth. It gives you the power to build strategies that are not only creative but also measurable, repeatable, and profitable. This is how you turn raw numbers into real, sustainable business success.
Essential Marketing Metrics You Must Track

Before you can work magic with data, you need to know what to measure. Focusing on the wrong key performance indicators (KPIs) is like trying to navigate with a broken compass—you’ll feel busy, but you won't actually get anywhere. The trick is to build a balanced dashboard of metrics that tells the complete story of your business's health, from grabbing new leads to keeping existing customers happy.
Think of these metrics in four main categories that follow the customer's journey. When you organize your analysis this way, you can easily spot what's working and diagnose exactly where your marketing funnel is leaking.
Let's break down the metrics that truly move the needle.
Customer Acquisition Metrics
This is all about the top of your funnel. These numbers show you how well you’re attracting new customers and, just as importantly, what it’s costing you to bring them in. They’re your first signal for whether your brand is reaching the right people.
- Customer Acquisition Cost (CAC): Simply put, this is your total marketing and sales spend divided by the number of new customers you won. A high CAC can be a red flag, often pointing to inefficient ad spend or targeting that's a bit off the mark.
- Traffic Sources: Knowing where your website visitors are coming from (like organic search, social media, or paid ads) is crucial. It shows you which channels are your heavy hitters, so you can double down on what works and pull back on what doesn't.
- Cost Per Lead (CPL): This metric boils down to how much it costs to generate one single lead. It's a fantastic indicator for judging the efficiency of specific campaigns, especially in the B2B world.
Keeping a close eye on these acquisition metrics is how you start spending your marketing budget smarter, not harder. This isn't just a hunch; it's a global trend. For instance, the Digital Marketing Analytics market in the Middle East and Africa is projected to hit USD 90.36 million in 2024 and is expected to grow at a massive 20.6% annually through 2031.
Engagement and Conversion Metrics
So, you’ve got their attention. Now what? You need to know if you're actually keeping it. Engagement metrics tell you how people are interacting with your brand, while conversion metrics track whether they take the action you want them to.
The most dangerous number in business is "one." One traffic source, one conversion strategy, one key metric. A holistic view, combining engagement with conversion, is essential for building a resilient marketing strategy that can adapt and thrive.
Here are the key metrics to watch:
- Conversion Rate: This is the percentage of visitors who complete a goal, whether that’s buying a product or just filling out a form. It's one of the most direct measures of how effective your marketing really is.
- Click-Through Rate (CTR): For your ads and emails, this is the percentage of people who saw your link and actually clicked it. A low CTR often means your copy is weak or your audience targeting needs a tune-up.
- Bounce Rate: This tracks the percentage of visitors who land on your site and leave after viewing only one page. A high bounce rate can signal a disconnect between your ad and your landing page, or it might just point to a clunky user experience. You can see how these metrics fit into the bigger picture by exploring https://grassrootscreativeagency.com/marketing-performance-indicators/.
Retention and Revenue Metrics
Getting a new customer is only the first step. The real, sustainable profit often comes from keeping them around for the long haul. These metrics shift the focus to the long-term value and loyalty of your customer base. When considering all your content, especially video, it's worth mastering video marketing analytics to ensure you're tracking the right data.
- Customer Lifetime Value (CLV): This is a projection of the total revenue you can expect from a single customer over their entire relationship with your business. A simple rule of thumb for a healthy business model: your CLV should be significantly higher than your CAC.
- Churn Rate: This is the percentage of customers who stop doing business with you over a certain period. A high churn rate is a major warning sign that something is off with your product, your customer service, or the post-purchase experience.
- Repeat Purchase Rate: This one’s straightforward—it’s the percentage of customers who come back to buy from you again. It’s one of the strongest indicators you have for genuine customer satisfaction and brand loyalty.
Unlocking Insights with Key Analysis Methods
Knowing what to track is a great start, but the real magic happens when you know how to interpret those numbers. Simply collecting data is like having a book written in a language you don't understand. The analysis methods below are your Rosetta Stone—they translate raw metrics into smart, actionable strategies.
Think of these methods as different lenses for looking at your data. Each one reveals a unique part of the story. By moving through them one by one, you build a complete picture of your marketing performance, starting with a simple recap of the past and ending with a clear roadmap for the future.
Of course, none of this works without a clean, organized dataset first. The process always starts with preparing your raw data to make sure the insights you pull are accurate and reliable.
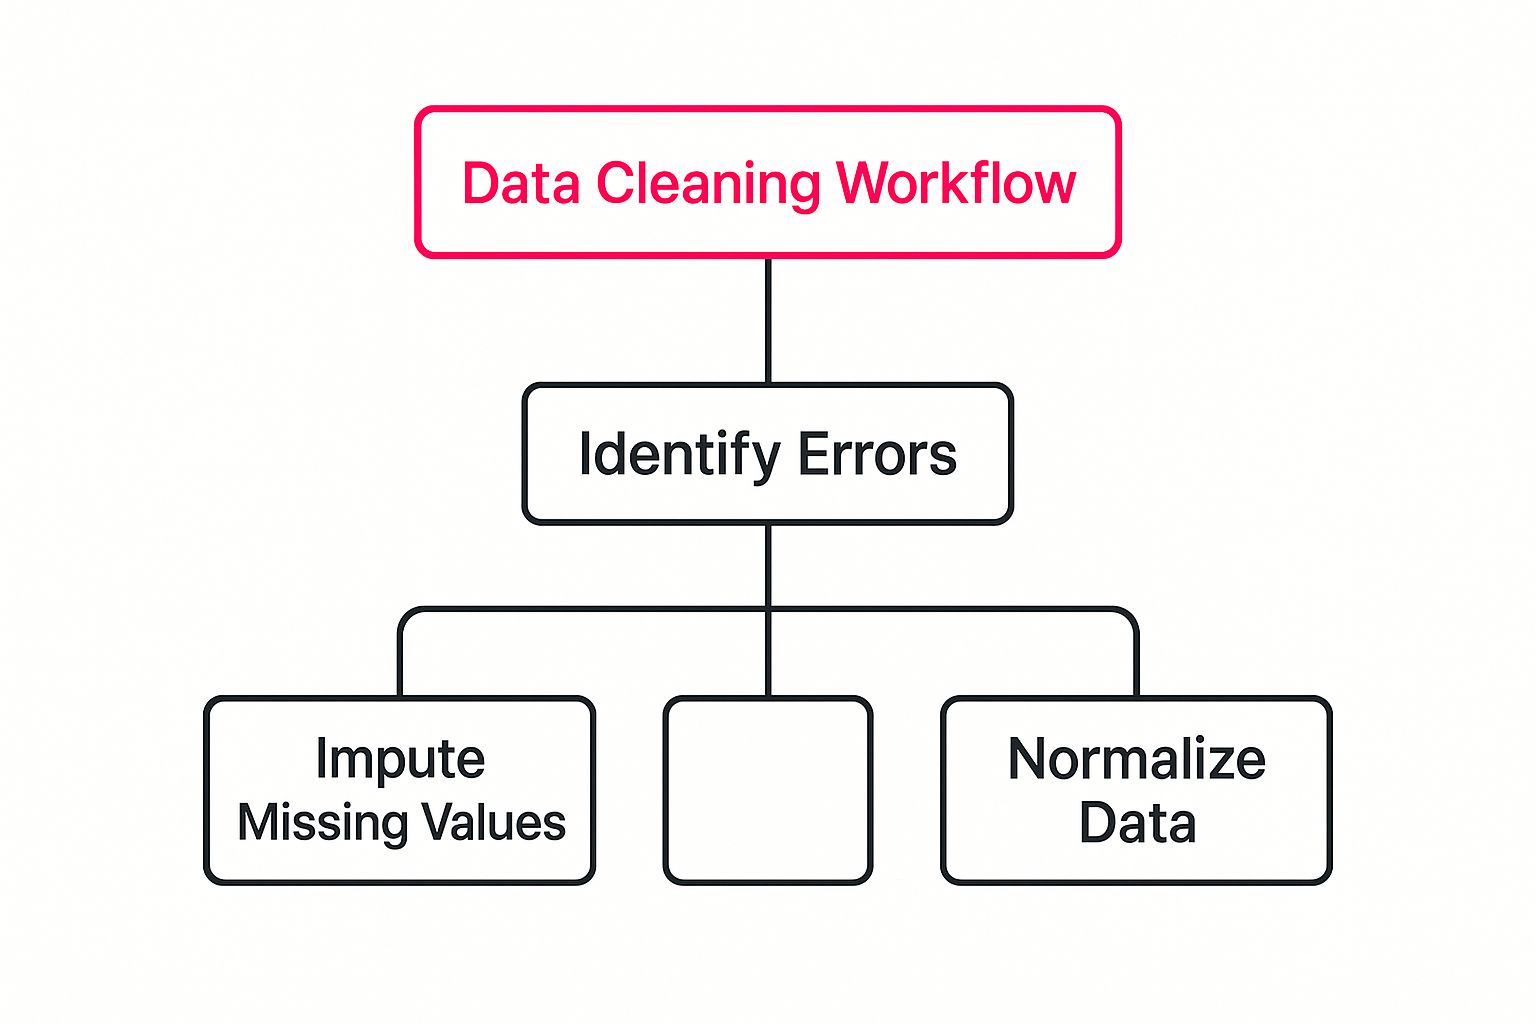
Before you can spot trends or make predictions, you have to get your house in order by fixing errors, dealing with missing information, and making sure all your data is formatted consistently.
Descriptive Analysis: What Happened?
This is the most fundamental type of analysis, the ground floor of understanding your data. It boils down all your raw numbers into something digestible, answering the straightforward question, "What happened?" It doesn't tell you why it happened, but it gives you a clear, factual snapshot of past performance.
Think of it as the highlight reel on your marketing dashboard.
- Example: Your monthly report shows that website traffic from social media jumped by 25% in October.
- Application: Descriptive analysis tells you the "what" (traffic went up), but it stops there. It's the essential first step that sparks deeper questions.
Diagnostic Analysis: Why Did It Happen?
Once you know what happened, the next logical question is, "Why?" This is where you put on your detective hat. Diagnostic analysis is all about digging into the data to uncover the root causes behind the numbers and connecting your actions to the outcomes.
You’re no longer just reporting the news; you're investigating the story behind it.
Diagnostic analysis is where you find the "aha!" moment in your data. It’s the difference between knowing sales dipped and discovering it was because a competitor launched a massive discount campaign that same week.
So, why did social media traffic increase by 25%? A diagnostic dive might show that one of your Instagram Reels unexpectedly went viral or that a new influencer collaboration drove most of that traffic. This kind of insight is crucial for repeating your wins and sidestepping future missteps.
Predictive Analysis: What Will Happen Next?
This is where data analysis starts to feel like a genuine superpower. Predictive analysis uses your historical data, statistical models, and machine learning to forecast what’s likely to happen next. It shifts your focus from explaining the past to anticipating the future.
This method empowers you to make proactive, forward-thinking decisions instead of just reacting.
- Example: By analyzing past customer behavior, you can predict which segments are most likely to stop buying from you in the next quarter.
- Application: With that prediction in hand, you can launch a targeted re-engagement campaign for those at-risk customers before they actually leave, protecting your revenue and improving retention.
This kind of foresight is incredibly valuable when you're building a long-term strategy. To help organize these data-driven goals, you can use a comprehensive startup marketing plan template to structure your approach.
Prescriptive Analysis: What Should We Do About It?
Finally, prescriptive analysis takes everything a step further. It doesn't just predict what will happen; it recommends the best course of action to get the result you want. This is the most advanced form of analysis, using sophisticated modeling to simulate the outcomes of different choices.
Think of it as a strategic GPS for your marketing. If predictive analysis warns you that rain is coming, prescriptive analysis tells you to grab an umbrella and suggests the best route to stay dry.
For instance, if your predictive model forecasts a dip in sales, a prescriptive model could analyze various scenarios—like offering a 10% discount versus doubling your ad spend—and recommend the option with the highest potential return. This approach creates a direct line from your data to your best possible business decisions.
Choosing the Right Data Analysis Tools

Picking the right software for your data analysis for marketing can feel like trying to choose the perfect tool from a packed hardware store. The options are endless, and it's easy to get overwhelmed. But here's the secret: the "best" tool isn't the one with the most features or the highest price tag. It's the one that actually fits what you're trying to do.
Think of it like this. You wouldn't use a sledgehammer to hang a picture frame. In the same way, a small startup's data needs are worlds apart from those of a global enterprise. Your team's size, budget, technical know-how, and ultimate marketing goals are what should guide your decision. Let’s walk through the main categories of tools so you can build a tech stack that works for you.
Web Analytics Platforms
These tools are your website's private investigators. They tell you everything that happens on your digital turf: who's stopping by, how they found you, what pages they're lingering on, and where they're bouncing. They are absolutely fundamental for understanding how real people interact with your site.
- Core Function: Measuring website traffic and user engagement.
- Key Questions Answered: Which channels are sending us the best traffic? Where are people getting stuck in our sales funnel? What content is actually resonating with our audience?
- Example Tool: Google Analytics is the classic starting point for a reason. It’s a powerhouse platform, and its free version gives you an incredible depth of insight, from traffic sources to real-time user activity.
Customer Relationship Management (CRM) Systems
While web analytics tracks mostly anonymous visitors, CRMs are all about the people you know—your leads and customers. A CRM acts as the central command center for every piece of customer data you have, from their first interaction to their entire purchase history. It’s the key to making your marketing feel personal, not robotic.
Centralizing this data is becoming a non-negotiable. In the Middle East and Africa, the United Arab Emirates is leading the charge in adopting this software. In fact, the regional digital marketing software market is expected to hit $1.12 billion in 2024. With a projected growth rate of 12.85% annually until 2032, it's clear that data-driven e-commerce is the future. You can learn about the booming digital software market in the region to see just how fast things are moving.
A well-implemented CRM turns scattered data points into a unified customer story. It allows you to see every touchpoint, from the first ad click to the most recent support ticket, enabling truly personalized and effective marketing campaigns.
- Core Function: Managing and analyzing customer interactions and data throughout their entire journey with you.
- Key Questions Answered: Who are our most loyal customers? What's our full conversation history with a particular lead? How can we slice our audience into segments for hyper-targeted campaigns?
- Example Tool: HubSpot provides a fantastic all-in-one platform, combining marketing, sales, and service tools with a powerful CRM at its core.
Business Intelligence (BI) and Visualization Tools
Once you're pulling data from your website, CRM, social media, and ad platforms, you’ve got a problem: it's all in different places. This is where BI tools come in. Think of them as the master conductors of your data orchestra, bringing all the separate instruments together to create one harmonious symphony. They connect to all your sources and turn raw numbers into beautiful, interactive dashboards.
These tools are brilliant for spotting high-level trends, comparing how different channels are performing side-by-side, and sharing key insights with executives who don’t have time to wade through spreadsheets.
- Core Function: Pulling data from many different sources and presenting it in easy-to-digest visual reports.
- Key Questions Answered: What’s our overall marketing ROI across every channel? How are our social media efforts actually influencing sales? What major customer behavior trends have emerged over the past year?
- Example Tool: Tableau is a leader in data visualization, giving you the power to build stunning, interactive dashboards from just about any data source you can throw at it.
To help you decide which type of tool best fits your current needs, here’s a quick comparison of the main categories we've discussed.
Comparison of Marketing Data Analysis Tool Categories
| Tool Category | Primary Use Case | Example Tools | Best For |
|---|---|---|---|
| Web Analytics | Tracking website traffic, user behavior, and conversion funnels. | Google Analytics, Adobe Analytics, Matomo | Businesses focused on optimizing their website performance and understanding on-site user journeys. |
| CRM Systems | Managing lead and customer data, tracking interactions, and personalizing communication. | HubSpot, Salesforce, Zoho CRM | Companies that need a single source of truth for customer data to align sales and marketing efforts. |
| BI & Visualization | Aggregating data from multiple sources into unified, interactive dashboards. | Tableau, Power BI, Google Looker Studio | Teams that need to analyze complex, cross-channel data and report on high-level business metrics. |
Choosing the right tool isn't about finding a single magic bullet. Most successful marketing teams build a "stack" that combines the strengths of different tools—using a web analytics platform for site data, a CRM for customer data, and a BI tool to bring it all together for a complete picture.
So, How Does Data Analysis Actually Win in the Real World?
Let's move past the theory. Knowing what data analysis is is one thing, but seeing it in action—delivering real, tangible results—is where things get exciting. This is where smart data use stops being a buzzword and starts being the engine that turns marketing from a cost center into a serious revenue driver.
The following stories aren't just concepts; they're blueprints for solving genuine business problems. We'll look at the challenge a company was up against, the smart data-driven solution they rolled out, and the impressive results that followed.
From One-Size-Fits-All to One-of-a-Kind: E-commerce in the MENA Region
The Problem: An online fashion brand in the Middle East had a classic e-commerce headache: customers would buy once and then disappear. Their generic email blasts were getting ignored, leading to a revolving door of customers and a ton of missed revenue.
The Solution: Instead of shouting into the void with another mass email, the team got forensic with their data. They dug into purchase histories, browsing patterns, and every customer interaction to find meaningful groups. Suddenly, they weren't looking at a faceless mob but distinct segments: "high-value VIPs," "discount-hunters," and "at-risk one-timers."
This insight fueled a completely new, hyper-personalized email strategy.
- VIPs received early access to new collections.
- Discount shoppers got exclusive deals on items they’d already eyed.
- At-risk customers were sent a friendly "we miss you" incentive to come back.
The Result: The shift was immediate and powerful. The brand saw a 40% jump in repeat purchases in just three months. By speaking directly to what each customer segment actually cared about, they turned a failing newsletter into a loyalty-building machine.
This isn't an isolated incident. The booming MENA e-commerce market, projected to keep growing strong through 2029, is built on this kind of smart targeting. In this competitive space, personalization isn't a "nice-to-have"—it's essential.
Cutting Through the Noise: A B2B Sales Overhaul
The Problem: A B2B tech company was drowning in leads. On paper, this sounds great, but in reality, their sales reps were completely overwhelmed. They were wasting precious time chasing dead-end leads while high-potential prospects got frustrated with slow follow-ups and went elsewhere. The whole sales cycle was sluggish, and revenue was taking a hit.
The Solution: The marketing team decided to build a data-powered filter: a lead scoring model. They analyzed their CRM's historical data, looking for the tell-tale signs of a lead that actually turned into a paying customer.
They started assigning points based on clear signals:
- Who they are: Job title, company size, and industry.
- What they do: Pages visited, whitepapers downloaded, or webinars attended.
- How interested they are: Visiting the pricing page or requesting a demo.
This model worked in real-time, automatically scoring and prioritizing every new lead. The "hottest" prospects were instantly flagged and sent straight to the top of the sales team's queue. To make this work long-term, you have to keep an eye on performance, which is where solid marketing campaign tracking is absolutely critical.
The Result: The sales team’s focus became razor-sharp. By zeroing in on the most qualified leads, they managed to shorten the average sales cycle by a whopping 25%. Team morale shot up, and with the best opportunities getting immediate attention, quarterly revenue followed suit.
Weaving Data Into Your Team’s DNA

So, you’ve invested in some powerful software and hired sharp analysts. That's a great first step, but it’s really only half the job. To truly tap into the power of data analysis for marketing, you need to make it a core part of your team's everyday thinking—it needs to become part of their DNA.
This is all about fostering a culture where asking "why" is second nature and data is the first place people look for answers. It's a deliberate shift, guided by leadership, that moves the team's default question from "What do we think will work?" to "What is the data telling us?" When this happens, everyone from your content writers to your social media managers starts thinking and acting like a strategic marketer.
Make Data Easy for Everyone to See and Use
First things first: you have to tear down the walls between your team and the data. If your insights are stuck on an analyst's hard drive, they can't shape the small, daily decisions that add up to big wins. The goal here is to make data accessible, putting key metrics right at the fingertips of the people who need them most.
- Build Central Dashboards: Use business intelligence tools like Google Looker Studio or Tableau to create clean, visual dashboards. These shouldn’t be complicated; they should give a real-time snapshot of the most important performance indicators for your active campaigns.
- Automate Your Reports: Nobody loves pulling manual reports. Set up automated emails that send key metrics to the team every week. This turns checking the numbers into a simple habit, not a dreaded chore.
When the data is just there—visible and easy to find—it naturally starts to creep into conversations. This simple step empowers your team to notice trends and ask better questions on their own, without waiting for the next big formal meeting.
A true data-first culture is one where every outcome, good or bad, is seen as a learning experience. The focus isn't on who gets the credit or blame, but on digging into the 'why' behind the numbers.
Boost Your Team's Data Confidence
Putting data in front of everyone is one piece of the puzzle. The other is making sure they feel comfortable using it. You don't need to turn every team member into a full-blown data scientist, but they do need a solid grasp of the metrics that impact their work.
This means focusing on practical training that’s tailored to each role. A content writer, for instance, should know how bounce rate and time on page reflect how engaging their articles are. A social media manager needs to be fluent in engagement rates and click-through rates. This kind of targeted education makes data analysis for marketing feel relevant and empowering, not overwhelming.
Create a 'Safe-to-Fail' Zone for Experiments
For a data-driven culture to stick, your team needs to know it's okay to try things and sometimes get them wrong. If a marketer runs an A/B test that doesn't pan out and gets criticized for it, you can bet they won't be volunteering to run another one anytime soon.
Instead, you need to celebrate the learnings from every experiment, win or lose.
Try framing your campaigns as educated guesses. For example, "Our hypothesis is that a video ad will grab more attention than a static image for this audience. Let's run a test and see what the data says." This simple reframing takes the ego out of the equation and turns marketing into a fun process of discovery.
By building this kind of environment, you’re really encouraging your team to innovate and constantly improve. They’ll start to see data not as a report card, but as a compass pointing them toward smarter decisions and, ultimately, much better results.
Frequently Asked Questions
Getting started with data analysis in your marketing can feel a bit like learning a new language. You know it's important, but it's easy to get tangled up in the details. Let's clear up a few of the most common questions that pop up when marketers start digging into their data.
My goal here is to give you some straightforward answers so you can move forward with confidence.
What Is the First Step in Data Analysis for Marketing?
Before you touch a single spreadsheet or open a dashboard, the absolute first step is to define your goals. You have to ask yourself, "What specific business problem am I trying to solve?" Are you looking to boost customer loyalty? Get more people to sign up on your website? Maybe you need to bring down the cost of each new lead.
Without a clear objective, you're just adrift in a sea of numbers. A specific, focused question acts as your compass, ensuring your analysis stays on track and the insights you pull out are actually useful for making smarter decisions. It’s the "why" that gives your work purpose.
The biggest mistake I see in marketing analytics is collecting data just for the sake of it. A clear, business-focused question is what turns raw numbers into a strategic game plan.
How Much Data Do I Actually Need?
This is a question I hear all the time, and the answer is usually simpler than people expect: start with what you already have. You don't need gigantic datasets to uncover meaningful insights. Often, the most powerful trends are hiding in plain sight within your existing website analytics or social media reports.
For instance, looking at just one month of website traffic can tell you which blog posts are resonating with your audience or which marketing channels are bringing in the most valuable visitors. The trick is to start small, find a few actionable takeaways, and then scale up your data collection as your team's skills and needs evolve. Remember, it’s about the quality of your insights, not the sheer quantity of your data.
Can Small Businesses Afford Data Analysis?
Absolutely. There's a common misconception that data analysis is only for big companies with deep pockets, but that's just not true anymore. Many fantastic tools offer free or affordable plans that are more than enough for a small business. Google Analytics, for example, gives you a world-class analytics platform at no cost. Many CRMs and email marketing tools also come with built-in analytics dashboards right out of the box.
For a small business, the focus should be on using these accessible tools to solve your most immediate challenges and drive steady growth. Consistent, simple analysis almost always delivers a better return than getting bogged down by overly expensive software you don’t really need. The real investment isn't money—it's curiosity.
Ready to stop guessing and start growing? At Grassroots Creative Agency, we live and breathe this stuff. We use data-driven insights to build smart, custom marketing strategies that actually work. Let us help you find the potential hidden in your numbers.